AI assistants already help a lot, but they work best when you can give them good context. In web apps, the most important context is usually the real traffic between frontend and backend: request URLs, payloads, and responses.
When debugging, I want to copy that information quickly and completely. And since I mostly work with UI5 and OData, I usually need the full URL plus request and response body. In Chrome DevTools that often means a lot of manuall copy pasting, and if you need more than one request, it gets annoying fast.
So I did the obvious thing: I built a small Chrome DevTools extension with AI help that solves this problem for me. Yes, I could also use MCP tooling or an automated browser to extract network data, but for day-to-day debugging I care about speed and I usually know exactly which requests matter.
After using it locally for a while, I decided to publish my first extension in the Chrome Web Store.
Install it here: Chrome Web Store
Update (2026-02-10): Also available in the Microsoft Edge Add-ons store.
Source code: GitHub
The solution
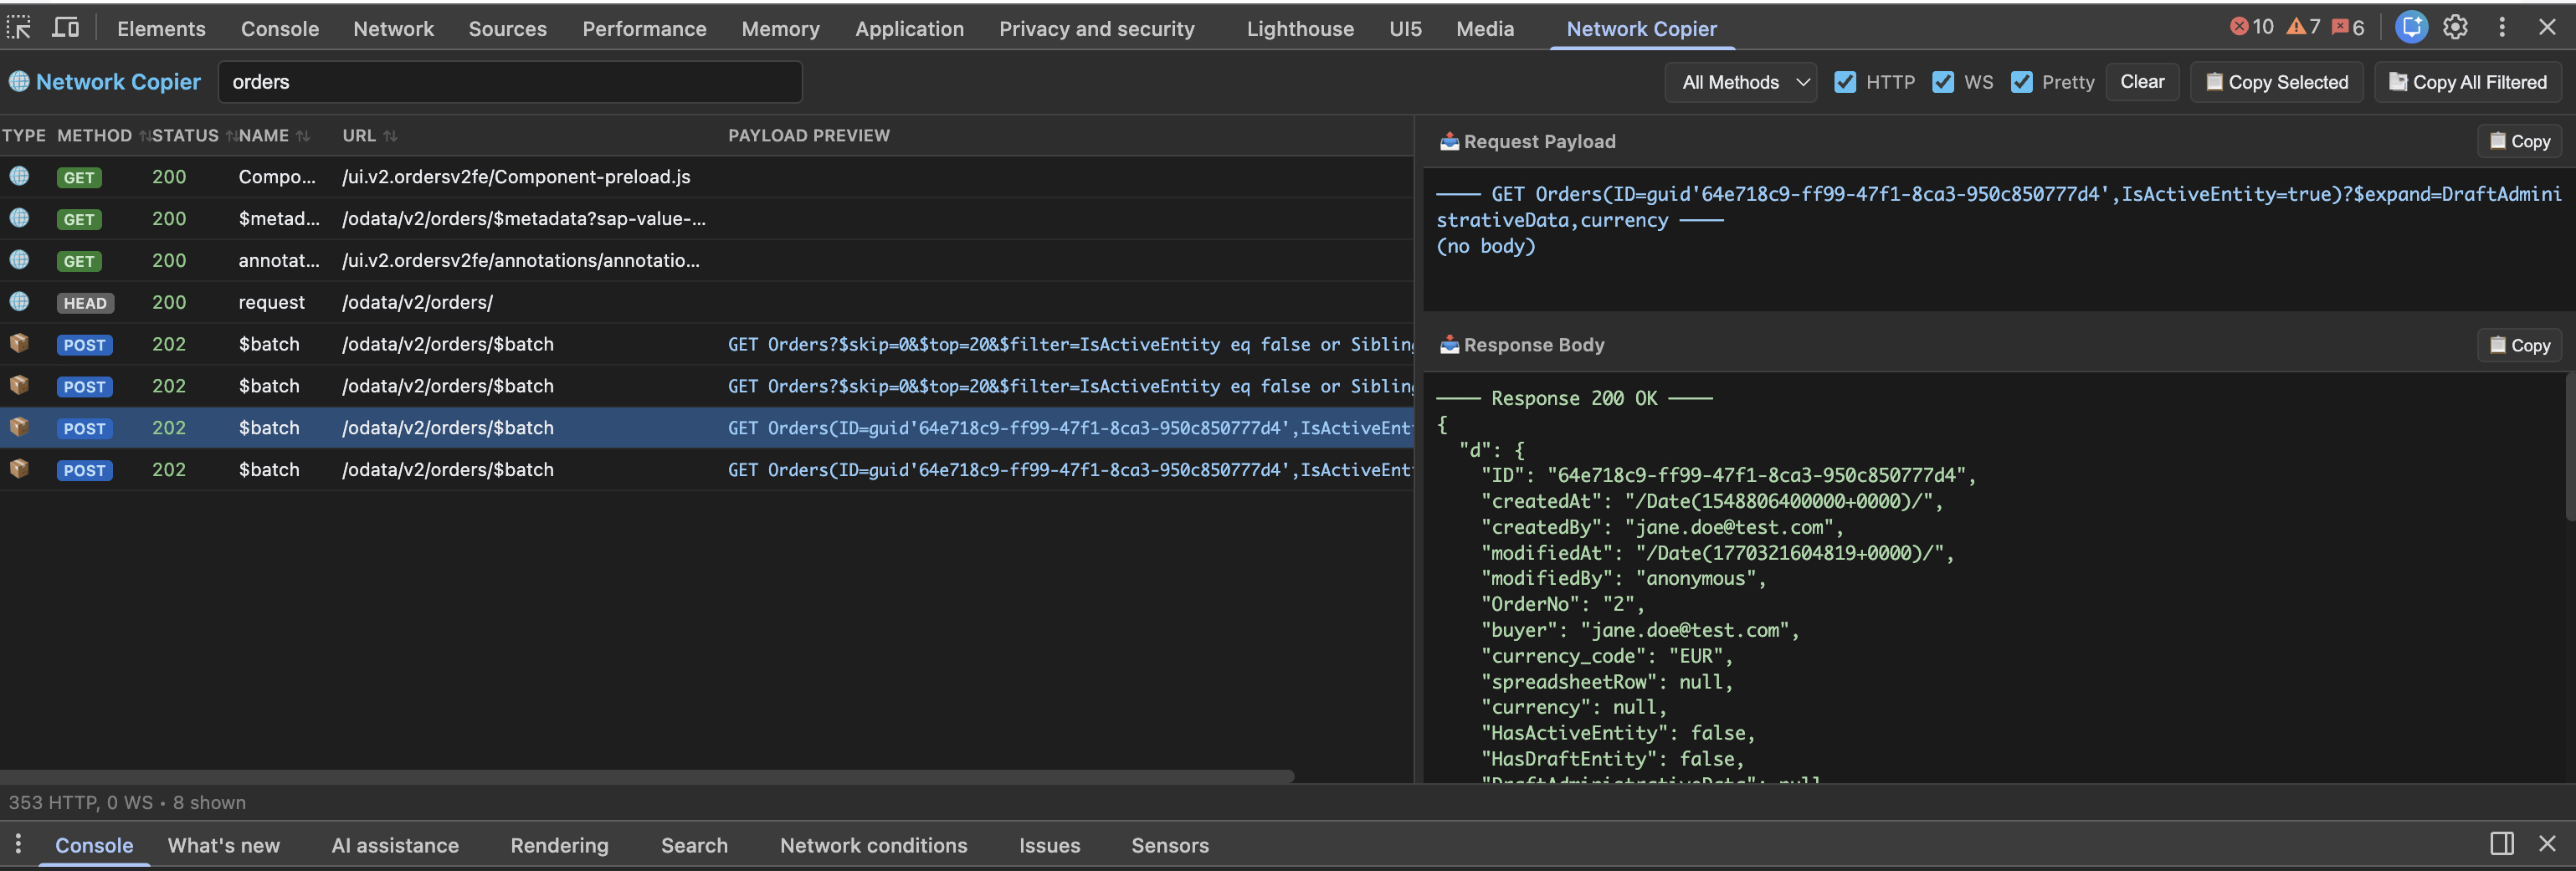
Network Request & Response Copier adds a dedicated panel to DevTools that shows network entries in a clean, sortable list.
- Left panel: sortable request list with filters, a payload preview, and pinning
- Right panel: request payload (top) and response body (bottom)
- Copy buttons: copy the selected entry, all filtered entries, or all pinned entries
And the part that matters most for my work: it makes OData traffic much easier to work with, especially $batch requests.
Key features
- Copy in one click: Copy the selected entry with
Ctrl/Cmd+C, or export all filtered or pinned entries. Output includes method, URL, payload, and response in one readable block. - OData
$batchparsing: Splits multipart$batchinto per-operation blocks and shows a quick “what’s inside” preview in the list (for example:PATCH MockConfig | GET Users). - Better OData overview: Keeps long
$selectand$filterURLs readable and shows request and response side-by-side, which makes sharing context (and debugging) much faster. - WebSocket included: Captures sent and received messages and shows them alongside HTTP entries.
- DevTools-like workflow: Sort, search, filter by method, resize panes, pin important calls.
- Stays fast: 500-entry cap, throttled UI updates, cached parsing.
How it works (short version)
- Runs as a DevTools panel, so it only exists while DevTools is open.
- Collects HTTP traffic via
chrome.devtools.network.onRequestFinished(HAR entries). - Detects and parses
$batchpayloads to show a per-operation overview. - Captures WebSocket messages by instrumenting
WebSocketin the inspected page. - Copies to clipboard with fallbacks that work in the DevTools environment.
You’re welcome to use it and let me know what you think, try it out suggest changes!